
Once your presentation is complete, you can view usage stats in Deepen Studio. On the dashboard, usage stats are displayed on the recent presentations. You can also view the stats for all past presentations via the "View all" link. There are two stats displayed for each presentation:
Unique participants – This is the number of individual users that viewed your presentation in the Deepen app.
Reactions – The total number of reactions (E.g. "Amens"), across all slides on your presentation.
All stats are anonymous to ensure the privacy of app users. Deepen does not collect any personally identifiable data when recording presentation statistics.
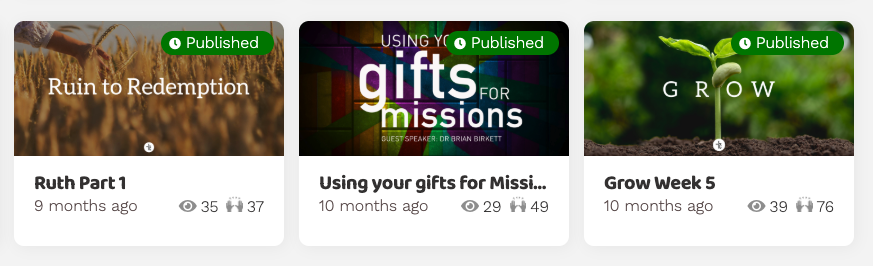
Stats are displayed on the bottom right of presentation cards.
Statistics are inclusive of participants and reactions over all time, not just while your presentation is "live". This means that views and reactions after your live presentation are also included in the numbers (e.g. when someone views the the presentation later to catch up)